Postgres Partition Pains - LockManager Waits
- kyle Hailey
- Jun 13, 2023
- 9 min read

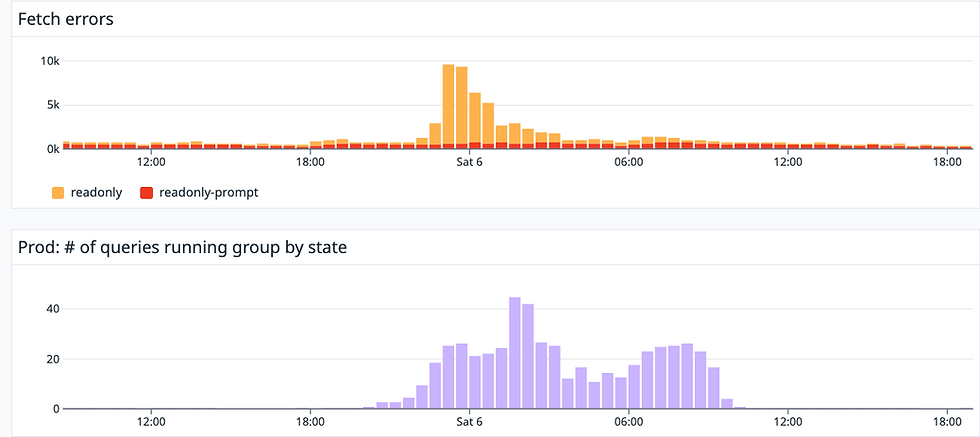
1000 Fetch errors a second, 500 sessions waiting on LockManager, 150,000 locks

In above graphs, our production system hit the wall by a blind siding pile up on LockManager waits causing the application to start hitting 1000 errors a second. I managed to mitigate the pileup by detaching 7 partitions for the core table.
Let's blend the mundanity of database administration with a dash of fictional narrative for palatability. Consider it akin to lacing my son's morning 'green' drink, brimming with dehydrated veggies, with a little apple juice to make the healthful concoction more appealing. Similarly, I'm adding a sprinkle of imaginative storytelling to sweeten the otherwise dry technical discourse.
Picture this: You're an experienced, 'gray-beard' database administrator walking into one of the most buzzed-about, innovative startups. Your entry ticket? Your depth of database expertise, a contrast to the young, speed-driven, visionary programmers who form the company's backbone. These bright minds are drawn towards the new and the sexy in technology. Still, when it comes to the data cache, they smartly opt for a tried-and-true solution - Postgres. They've done a commendable job in setting it up, but the database is burgeoning beyond the realm of manageability. We're talking 8TB, with 10,000 queries per second, and 10 million new records daily, each receiving an average of three updates. Managing this is no small feat, and that's where your expertise comes in
The primary function of the orders table is to serve as a queue for new work requests from customers. This table essentially takes customer requests, processes them, and logs the completed tasks. In addition, it doubles as a work history ledger, allowing customers to look up past work orders. However, the speed of some of these lookup queries is starting to lag.
Implementing new indexes has proven time-consuming, with each addition taking about 12 hours, when run concurrently. This significantly dampens our ability to experiment with new indexes. Moreover, dropping an unused index imposes a lock that stalls all new queries, further thwarting index adjustments. While using HypoPG might address this issue, that's a tangent for another day.
My central focus was to partition the table. I believed partitioning could enhance query speed by constraining them to specific partitions. It could also make index experiments swifter and permit maintenance operations to be conducted on a partition-by-partition basis.
I previously detailed the partition conversion journey on this blog, which can be found at https://www.kylehailey.com/post/postgres-partition-conversion-minimal-downtime.
After successfully converting the partition, we observed a general improvement in speed. Vacuuming operations became more efficient, allowing us to handle them partition by partition. Then, I pivoted to focus on the "real" work of fine-tuning the queries that still ran slowly after the conversion.
For about four weeks, everything was going smoothly. But then, one fateful Saturday morning - May 6, to be exact - the database began to experience severe LockManager waits. This marked a sudden change from the smooth operation we'd seen since the partition conversion on April 1. The primary function of the database, the work queue operation, started to stall.
Here is a graph of LockManager waits by # of sessions waiting. We can see that there looks to be little or none until about May 3, the first purple bar. Then 2 days later the bar goes high enough to cause application disruption
LockManager Waits by # of sessions waiting

LockManager waits compared to application errors
Here is a zoomed in view of May 6 showing application errors on top graph correlated with lockmanager waits on bottom graph.
Log scale
When we examine the LockManager waits on a logarithmic scale, it becomes apparent that these waits actually commenced on April 11, a mere ten days after the partition conversion. This suggests that once we hit 12 partitions (including all old data in one partition, and then a partition for each day from April 1-11), the database began to struggle with managing the volume of lock requests. With each partition having 22 indexes, querying the orders table involves >220 locks per query (10 partitions x 22 indexes).
Fast forward to 40 days later, and the LockManager waits had become a significant part of the total waits. At this point, we had 40 partitions x 22 indexes, equating to 880 locks per query. Despite my efforts to explicitly limit queries to specific partition ranges, the database continued to enforce locks for every partition.

Upon initially partitioning the orders table, my apprehension centered on the potential issue of an increasing number of partitions, with parse and execution times progressively lengthening. I had anticipated a slow, gradual increase in latencies. I certainly did not foresee the database hitting an abrupt wall! After investing two weeks in ensuring minimal downtime during the conversion of orders into a partition table, the bitter revelation arrived four weeks later: I was in a significantly worse position post-conversion. With the database hitting the wall, and the prospect of rebuilding the orders table translating to around two hours per day, or an overwhelming 80 hours of conversion time over 40 days, I found myself utterly taken aback.
At first I had no idea what LockManager waits were caused by. I found slim information via google searches. I did see references to Postgres running out of fast locks , and that each session has 16 fast locks. I don't understand the dynamics. I mean the queries were allocating > 800 so hows do the 16 fast path locks play in that scenario with queries allocating > 800 locks?
Amazon RDS has the best documentation I found on LockManager waits at https://docs.aws.amazon.com/AmazonRDS/latest/UserGuide/wait-event.lw-lock-manager.html
On that page they have a query to see how many locks are allocated by PID:
SELECT count(*), pid, mode, fastpath
  FROM pg_locks
 WHERE fastpath IS NOT NULL
 GROUP BY 4,3,2
 ORDER BY pid, mode;

 count |   pid   |       mode       | fastpath
-------+---------+------------------+----------
   332 | 1125230 | AccessShareLock  | f
    16 | 1125230 | AccessShareLock  | t
     1 | 1125230 | ExclusiveLock    | t
   332 | 1125512 | AccessShareLock  | f
    16 | 1125512 | AccessShareLock  | t
     1 | 1125512 | ExclusiveLock    | t
    16 | 1125668 | AccessShareLock  | t
   332 | 1125668 | AccessShareLock  | f
   ...
For the PID , I could join to pg_stats_activity and see how many locks each query was allocating.
The RDS documentation suggest reading the Postgres source code for more detail https://github.com/postgres/postgres/blob/master/src/backend/storage/lmgr/README#L70-L76
Here are few relevant google search results
each backend can only acquire a
maximum of 16 relation locks via the fast-path mechanism.  If a
process acquires more than 16 relation locks, at least some of them
will have to be acquired without benefit of the fast-path.  This value
could be changed by changing the value of the constant
FP_LOCK_SLOTS_PER_BACKEND, but since we scan the array linearly,
making it too big will lead to other problems.
https://gitlab.com/gitlab-com/gl-infra/scalability/-/issues/2301
If the holder of a lock_manager lwlock stalls for a few microseconds, that is ok and normal. But stalling for hundreds or thousands of microseconds is long enough for other transactions to need the same lwlock. Since the waiters each require this lwlock in exclusive mode, they all have to wait for the current holder to release it. This snowballs quickly when the lwlock is held for long enough to approach the mean query duration -- at that point it is very likely for many other transactions to stall waiting for that lwlock to become available.Good thread with lots of info to read
16 looks easily exceeded even in a not-long OLTP transaction... especially the table is partitioned.  I wonder if we're
caughtin the hell of lock manager partition lock contention without knowing it.  I'm afraid other pitfalls are lurking
whenthere are many relations.
I added monitoring of lock allocations in mid May to see if I could correlate how many lock allocation caused the issue but there was no obvious limit.
SELECT locktype, mode, COUNT(*) FROM pg_locks GROUP BY locktype, mode;
On the other hand , as I took partitions out of the core table the lock allocations went down as did the lockmanager waits (top graph is application errors, bottom graph is database load aka # of queries running concurrently. The dark purple in this case is the lockmanager waits)

When the first spike occurred May 6 and then subsided, I started to build week partitions from the day partitions, in order to swap out the day partition for week partitions to have less partitions.
It took 2 hours to add one day of data to a week partition. I'm like WTF, it's only 10G of data?!
As think about it, I'm like , "ok, there are 22 indexes and oh yeah, it's trying to replicate that across to the replica, so lets take off all the indexes"
So I did a copy of one of the the orders table partition using (LIKE orders ) .
Took off all the indexes, loaded a week of data, then when I swapped out the 7 days for the new week, all hell broke loose. I had left the office for the evening only to get a frantic call that orders were failing. I'm like "come on, that couldn't be the partition change" but alas the log files were giving an error that the new partition was not part of the replication set, so on the phone, I'm "just add it". They tried and it gave the response from Postgres as "replication is managed automatically, can't make modifications manually" !? This was over the phone, and I never looked at this issue in detail. But I raced home and took the week off line. Now or orders database was running with a week of data missing. Our main function of processing orders was working fine, but customers were getting upset that the couldn't find old orders.
Try number 2, I'm like 14 hours to rebuild a week is just too long.
This time I do a "create table orders_week_x (LIKE orders_day_y INCLUDING ALL)" which picks up the replication definition. I'm still like "how can I speed this up? oh, how about unlogged"?
Lets take off the indexes and alter it unlogged.
Then I swap in the week partition ... and wait and wait and wait . I'm WTF?
Then I'm like , "oh, its propagating the partition to the replica because I made it with "unlogged" . Well I wanted to do the swap in fast, so that's no go. OK, fine, I'll just build them the slow way. I guess I should have done that from the beginning. Still don't think 10G should take 2 hours.
CREATE TABLE orders_23_05_03_week (LIKE orders_23_05_03  INCLUDING ALL);


-- find and drop the constraint on the partition we are copying
-- we are coping a one day partition and need to drop the 1 day
-- constraint and then add a week time window constraint

SELECT
      c.conname AS constraint_name,
      n.nspname AS schema_name,
      t.relname AS table_name,
      pg_get_constraintdef(c.oid) AS constraint_definition
FROM
      pg_constraint c
JOIN
      pg_namespace n ON n.oid = c.connamespace
JOIN
      pg_class t ON t.oid = c.conrelid
WHERE
       t.relname = 'orders_23_05_03_week';

 alter table orders_23_05_03_week drop constraint orders_23_05_03_constraint;


insert into orders_23_05_03_week  select * from orders_23_05_03;
insert into orders_23_05_03_week  select * from orders_23_05_04;
insert into orders_23_05_03_week  select * from orders_23_05_05;
insert into orders_23_05_03_week  select * from orders_23_05_06;
insert into orders_23_05_03_week  select * from orders_23_05_07;
insert into orders_23_05_03_week  select * from orders_23_05_08;
insert into orders_23_05_03_week  select * from orders_23_05_09;


select to_char(min(order_time), 'YY-MM-DD') ,
       to_char(max(order_time), 'YY-MM-DD')
from orders_23_05_03_week;


ALTER TABLE orders_23_05_03_week ADD CONSTRAINT orders_23_05_03_week_constraint
CHECK ( order_time IS NOT NULL AND
order_time >= '2023-05-03'::timestamp without time zone AND
order_time < '2023-05-10'::timestamp without time zone ) NOT VALID;

ALTER TABLE orders_23_05_03_week  VALIDATE CONSTRAINT orders_23_05_03_week_constraint;

ALTER TABLE orders ATTACH PARTITION orders_23_05_03_week
FOR VALUES FROM ('2023-05-03') TO ('2023-05-10');
On May 10th , four days after I took the first week of partitions, we hit the wall again, which caught me by surprise. I thought we would have had a couple more days of grace:

The purple on the top graph is the lockmanager waits. The red on the right hand side is me trying to detach partitions. Another fun fact is Postgres locks the table when detaching partitions, so any running queries will block the detatch and any queries that come along while the detach is wait will block. So detaching a partition hosed up the whole application. Fun fun. I thought the big point of partitions was online operations. I guess not, at least not in the Postgres world.
In order to block as least amount of time possible I wrote a script to kill all blockers. There were generally half a dozen blockers but several hundred waiters. It was better to kill the few blockers than to make the waiter wait longer. Waiters time out pretty fast loosing the customers order request
select
	round(EXTRACT(EPOCH FROM (clock_timestamp() - query_start))::numeric, 5) as query_age ,
    round(EXTRACT(EPOCH FROM (clock_timestamp() -  xact_start))::numeric, 5) as xact_age,
	pid,
	pg_blocking_pids(PID),
	wait_event,
	substr(query , 1, 80)
	query ,
	*
	--,  pg_terminate_backend(PID)
from pg_stat_activity a,
		(select  unnest( string_to_array(replace(replace(pg_blocking_pids(PID)::text,'{',''),'}',''), ','))  as bpids,
		         lower(query)
		 from pg_stat_activity
		 where lower(query) like '%drop%' or lower(query) like  '%alter%'
		) b
where
  PID = b.bpids::integer ;
You can run this query to see who is blocking and how long they have been running. Uncomment "--, pg_terminate_backend(PID)" to kill all the blockers
After successfully rebuilding all day partitions as week partitions things are running smoothly, but I figure we only have 4 - 6 months before we hit the problem again.
One options is upgrading to PG14 where apparenlty if I have a predicate filter limiting the query to one partition , then it will only take locks out for that partition ( like right?) where as on PG13 even a query limited to a 1 day partition took out locks on all the partitions on all the indexes. Sigh


Sau một thời gian theo dõi, https://luck8.so/ khiến mình chú ý nhiều hơn đến cách hiển thị dữ liệu. Trong lúc xem khu Sicbo, mình cũng quan sát phần thống kê được bổ sung ở một số khu vực thông tin. Điều đó giúp việc nắm bắt nội dung diễn ra thuận tiện hơn mà không cần mở thêm nhiều mục khác nhau. Đây là một điểm mình ghi nhận được sau nhiều lần quay lại.
SITUS TOTO
Keep up the good work; I really like this article.
BEJOTOTO
BEJO TOTO
TOTO
I really like the articles you provide; they have greatly broadened my horizons.
IDRTOTO
IDR TOTO
I really like the articles you provide; they have greatly broadened my horizons.
AKUNTOTO
You are very talented; I will definitely keep following these articles.