Auto_explain on Google Cloud SQL (GCP)
- kyle Hailey
- Apr 8, 2023
- 4 min read

Getting Started with Google Cloud SQL and Auto Explain for Performance Monitoring
Introduction:
After three decades of experience with Oracle and six years working with Amazon AWS RDS, I am now diving into Google Cloud Platform's (GCP) Cloud SQL. As I get up to speed with this new service, I have been using Datadog to monitor my database, which has been quite helpful. In this blog post, I will share my experience of setting up auto_explain to capture explain analyze plans for long-running queries in Google Cloud SQL.
Monitoring Database Performance with Datadog:
Datadog is a powerful monitoring tool that provides valuable insights into database performance. Although it captures explain plans, it only does so with the basic explain command, rather than the more informative explain analyze. The reason for this is that explain analyze can add significant overhead to query execution, and a monitoring tool like Datadog would need to run the query itself to obtain the output.
Using Auto Explain with Analyze Option for Long-Running Queries:
To address this limitation, we can use the auto_explain extension with the analyze option in Cloud SQL. By doing so, we can capture explain analyze plans for long-running queries without adding much overhead. Since long-running queries are already slow, the additional time required for explain analyze is not a significant concern, and auto_explain captures the plan while the query is running, eliminating the need to rerun it.
Setting up Auto Explain on Google Cloud SQL:
To set up auto_explain in Google Cloud SQL, you need to make changes to the instance configuration and restart the database. Here are the steps to enable auto_explain and configure its settings.
You need to set the following parameter to on
cloudsql.enable_auto_explain You change this by changing the "flags" on the cloud sql instance details page.
Go to
And click on the instance you are interested in. The go to "edit configuration"

then go to Flags, add flags
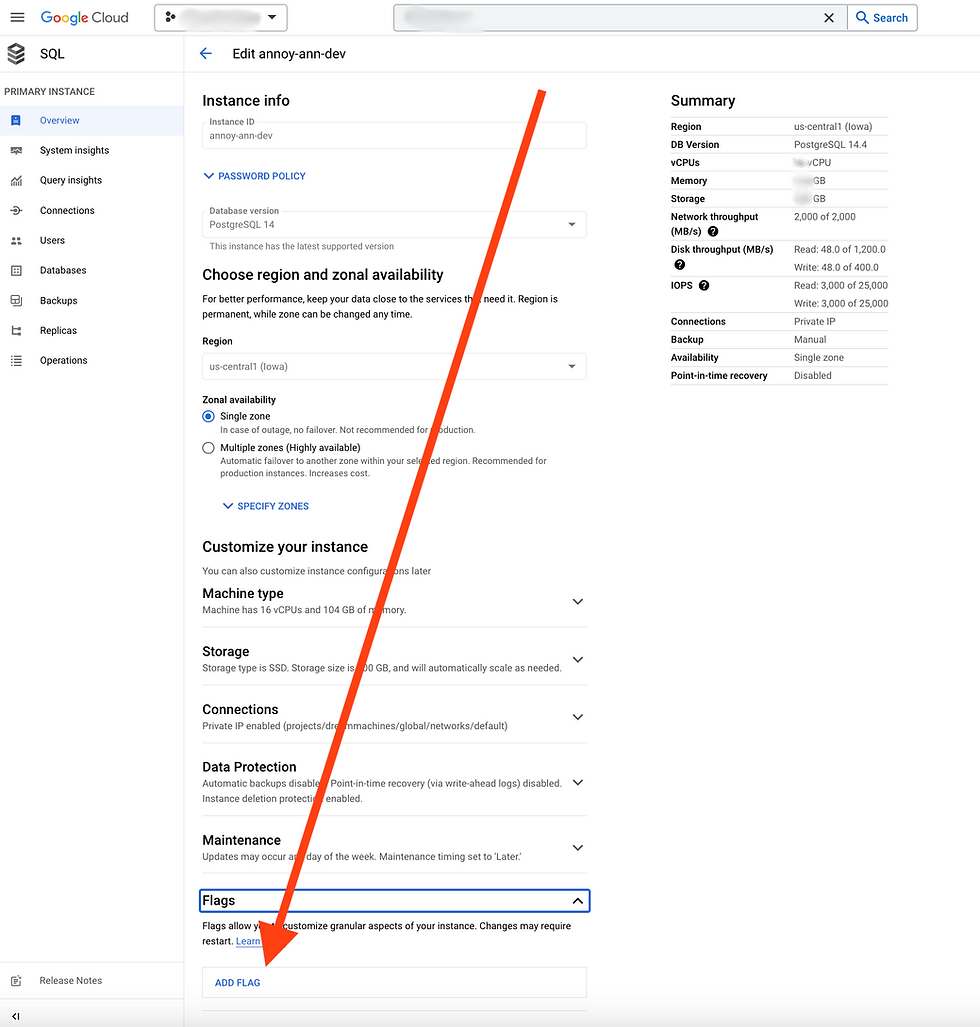
Then add
cloudsql.enable_auto_explain onand rebooot.
One thing disappointing about GCP is if you change a FLAG you have to bounce the database to save it. On Amazon RDS , you can save it and leave it there to be applied the next time the instance is bounced or there is a planned maintenance window.
To set the values via API, which is super important for maintence scripts and when changning many values here is an example
curl -X PATCH \
     -H "Authorization: Bearer $(gcloud auth print-access-token)" \
     -H "Content-Type: application/json" \
     -d '
     {
  "settings": {
    "databaseFlags": [
      { "name": "cloudsql.enable_auto_explain", "value": "on" },
      { "name": "track_activity_query_size", "value": "32768" }
    ]
  }
}
 ' \
"https://sqladmin.googleapis.com/sql/v1beta4/projects/${PROJECT_ID}/instances/${INSTANCE_NAME}"
To run script you need to set
PROJECT_ID="your_project" INSTANCE_NAME="your_instance"which you can get from the GCP console

WARNING: this API call bounces the database (serious not cool, should be an patch only option and a patch with bounce option)
Once
cloudsql.enable_auto_explain onis set and the database is bounced, then you need to go and set the auto_explain parameters in the database:
see https://www.postgresql.org/docs/current/auto-explain.html for options explanation
You can run these with your favorite Postgres tool. I'm using "psql" and/or "dbeaver"
-- uses Explain (Analyze) instead of just explain
ALTER DATABASE your_db SET auto_explain.log_analyze = true;

-- uses Explain (Buffers) instead of just explain
ALTER DATABASE your_db SET auto_explain.log_buffers = true;

-- default output is text
-- ALTER DATABASE your_db SET auto_explain.log_format = JSON;
-- choose your slow SQL time in ms. Here is 3 seconds
-- 0 is all, -1 is off
ALTER DATABASE your_db SET auto_explain.log_min_duration = 3000;

-- analyze queries in functions
ALTER DATABASE your_db SET auto_explain.log_nested_statements = true;

-- log non default partameter that affect plan
ALTER DATABASE your_db SET auto_explain.log_settings = true;

-- TIMING option of EXPLAIN, has a significant overhead
ALTER DATABASE your_db SET auto_explain.log_timing = true;

-- causes trigger execution statistics to be included
ALTER DATABASE your_db SET auto_explain.log_triggers = true;

-- VERBOSE option of EXPLAIN
ALTER DATABASE your_db SET auto_explain.log_verbose = true;

-- equivalent to the WAL option of EXPLAIN
ALTER DATABASE your_db SET auto_explain.log_wal = true;

-- default 1, smaller values sample that % of total qualifying sql
ALTER DATABASE your_db SET auto_explain.sample_rate = 1;
Once the instance has
cloudsql.enable_auto_explain onis bounced and the auto_explain.% parameters are set on the database in the instance your want to monitor , then when queries are slower than auto_explain.log_min_duration you should start finding your queries in the logs. Go to
and add in the query:
resource.type="cloudsql_database"
resource.labels.database_id="your_project:your_instance"
logName="projects/your_project/logs/cloudsql.googleapis.com%2Fpostgres.log"
textPayload: "Query Text:"
change your_project to your project
change your_instance to your instance
The "trick" to finding explain plans is textPayload: "Query Text:"
Logs uses "textPayload:" value to grep/search for the matching log entries.
I don't know what the proper search value should be but "Query Text:" is a string that shows up in explain plans and seems to work.
The output should look like

Then you can click on a row and see the explain plan for that query.


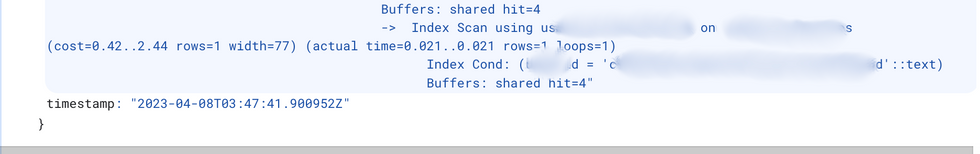
I then take that plan and put it into https://explain.depesz.com/

Conclusion:
By using auto_explain with the analyze option in Google Cloud SQL, you can gain valuable insights into the performance of long-running queries without putting undue strain on your database. This information can help you optimize your queries and improve overall database performance. Stay tuned for more posts on monitoring and optimizing Google Cloud SQL using Datadog and other tools.


Kyle 2 questions. 1 - how does setting log_min_duration = 3000 work. Meaning engine doesnt know at runtime if actually over or less than 3 secs - means its actually capturing ALL statements by default - but only writes to logs if over 3 secs ? Impact ? 2 - what parameter controls writing messages to log versus client.